Instructions
Here's a basic guide to get started with viewing the Google Analytics 4 dashboard reports for a marketing department:
- Go to the Google Analytics website (analytics.google.com) and sign in with your Google account.
- Access the Google Analytics 4 Property: After signing in, you will be taken to the "Home" screen.
- You can find all your reports by clicking Reports
 on the left. This will take you to the default Google Analytics 4 dashboard.
 - You will find the following types of reports on the left:
- Overview report: This is a report that summarizes information about a topic; for example, the Acquisition overview and Engagement overview reports.
- Detail report: This is a report that allows you to drill into one or two dimensions to investigate your data in greater detail; for example, the Events, and acquisition reports.
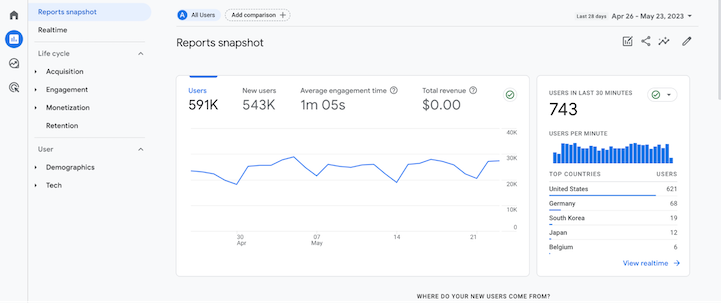
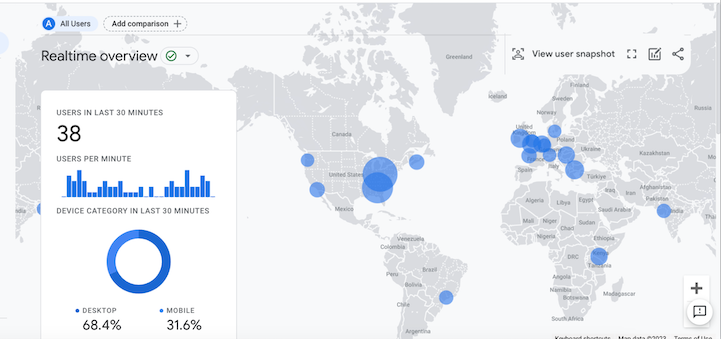
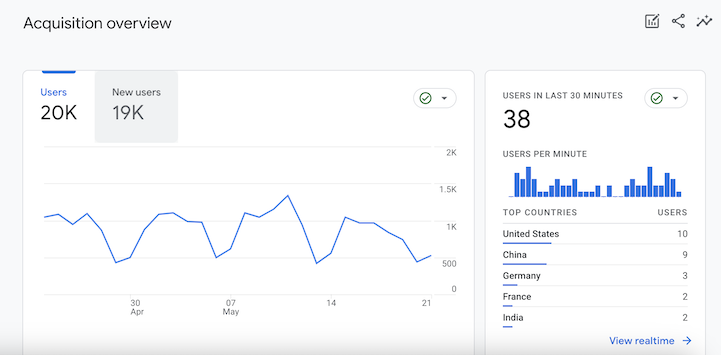
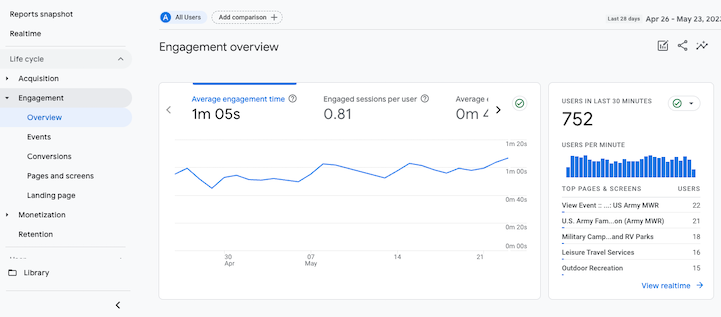
- Explore the dashboard: The Google Analytics 4 dashboard provides an overview of key metrics and insights. Here are some example key elements you'll find:
Reports snapshot: This section provides a summary of your website's performance, including metrics like total users, sessions, engagement, and conversion rates.
Realtime overview: This section shows the current activity on your website in realtime, including active users, top active pages, traffic sources, and more.
Acquisition: This section shows how users are finding your website, including sources such as organic search, paid advertising, social media, and referrals.
Engagement: This section tracks conversion events and goal completions on your website, allowing you to analyze the effectiveness of your marketing efforts. This section also gives insights into how users interact with your website, including page views, average time on page, bounce rate, and top content.
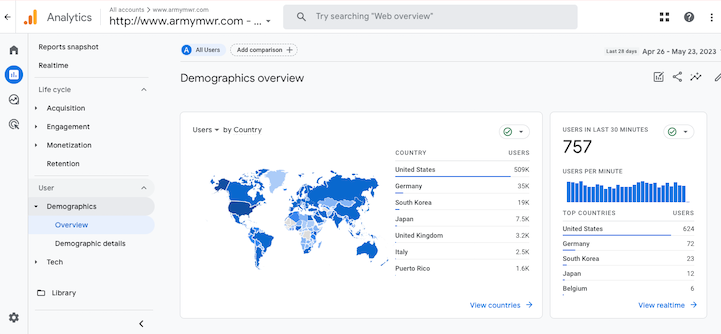
User: This section provides insights about your website visitors including demographics, interests, technology, and behavior.
Remember, this is just a basic guide to get started with viewing the Google Analytics 4 dashboard. As you become more familiar with the platform, you can explore advanced features and reports to gain further insights into your marketing efforts.

2026 Second Quarter Analytics
Army MWR delivered strong growth across all traffic metrics during Q2 FY26. Total users grew 19.4% year over year to 7,285,317, and new users rose 18.9% to 6,998,139, indicating the enterprise is successfully expanding its reach to first-time...

Life Skills
Life Skills Documents Life Skills SOP BOSS Life Skills Timeline BOSS Checklist BOSS CONOP BOSS Storyboard

ESMC 3.0 Senior Commander Brief
ESMC 3.0 Senior Commander Brief Summary ESMC 3.0 represents a structural modernization of Army MWR’s digital ecosystem, shifting from...

Better Opportunities for Single Soldiers (BOSS) 2025
BOSS 2025 The Better Opportunities for Single Soldiers program sustained steady digital engagement throughout the reporting period, reflecting...

DHL 6 Days 5 Night Package
DHL 6 Days 5 Night Package The DHL 6 Days 5 Night Package page is performing as a high-intent booking asset, generating 2,311 users with a 90%...

2026 First Quarter Analytics
In the first quarter of FY26, ARMY MWR websites demonstrated steady growth in user engagement and visits. Total users and page views increased,...

Transitions Report
Learn how to use Matomo’s Transitions report to understand how users arrive at a page, what they click next, and how to identify internal...

2025 Fourth Quarter Analytics
ARMY MWR digital engagement strengthened in Q4 FY25, with 2,363,810 total users (up 8.6% year-over-year). Pageviews rose to 6,152,314 (+5.9%), and...

Continuity Book
These resources will allow you to take the products provided below and make them fit to your Garrison. There are many different documents and...